

Here you are learning to create burndown charts with Jira software. We are going to everything learn burndown chart with jira software which is the following:
What Is Jira Software?
Jira Software is part of a package of tools for managing work in teams of various sizes. Firstly, Jira was created for bug tracking. Burndown charts have since evolved into an effective task management platform for a variety of applications ranging from requirements and test case management to agile software development.
What Is a Burndown Charts In Jira?
Learn burndown charts with Jira software similar to the project trackers. These are graphics that help to represent a project’s progress. Along with this, also helps in the planning and monitoring of the sprints. It shows the amount of work that has already been completed in a dash as well as the amount of work that has still to be completed.
You can use burndown charts by Groups. Also, they’ll be able to meet their goals and finish the task within the timeframe they’ve set. Additionally, Burndown charts can also help the team in identifying scope creep that may have occurred throughout the sprint.
Purpose of charts
The Learn burndown charts with Jira software play a crucial role to analyze teamwork. Following are some key points that will describe the purpose and features too of the burndown chart.
- Helps to understand the actual and estimated work.
- Beneficial in tracking sprint progress.
- Helps to identify the problems.
- Can measure past and present performance.
How to Create Burndown Charts in Jira ?
Undoubtedly, you have to follow the steps which are below.
Decide the Estimation statics for your team
- Firstly, you have to decide the estimation. Estimation is a piece of measurement which your team will use to estimate work. This will help to measure the team’s performance.
- The velocity is the total of the Estimation Statistic for finished products for each sprint. If your team’s velocity is consistent, you can use it to estimate how much work they can complete in each sprint, which helps in sprint planning.
- Go to the board>click the more button>select the “Estimate” from the dropdown menu.
Define your issues
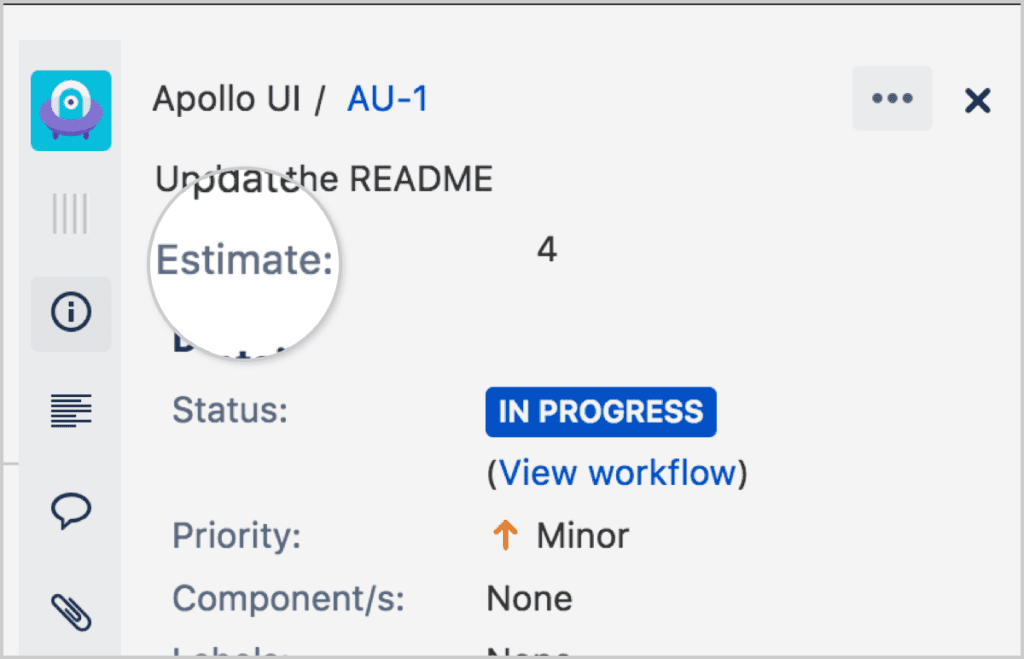
- Firstly, select an issue on your board or in the backlog for your Scrum project.
- Secondly, click the “Estimate” field in the issue details.
Draw the Burndown chart to track the team performance
There are two types of burndown charts. These are the following:
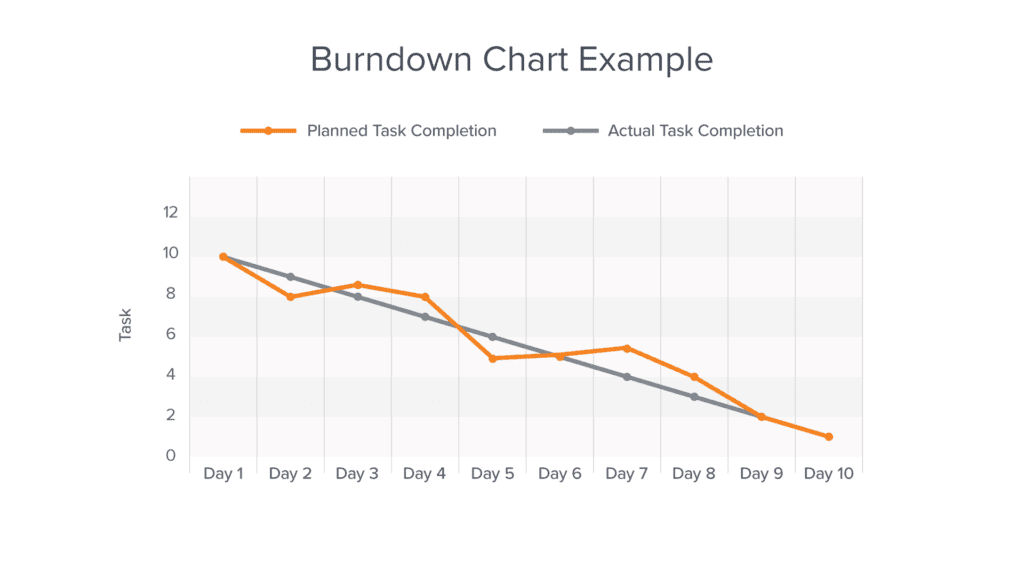
Sprint burndown charts
This helps to measure how much work had done. As well, it helps to find out the remaining work in the sprint.
Sprint burndown chart has 3 important points that you must know. These are the following:
- Estimation static
Here the vertical line “Task” is representing the estimated statics.
- Guidelines/Actual Task completion
The grey color line is showing the actual task. Also, learn burndown charts with jira software this will work as a progress line. As result, we will measure the progress of the team on the base of this line.
- Remaining Values/planned task completion
The yellow color line in the pic is representing the remaining value. Clearly, this means that on the base of this line we will measure the progress that how much work is remaining.
Epic burndown chart
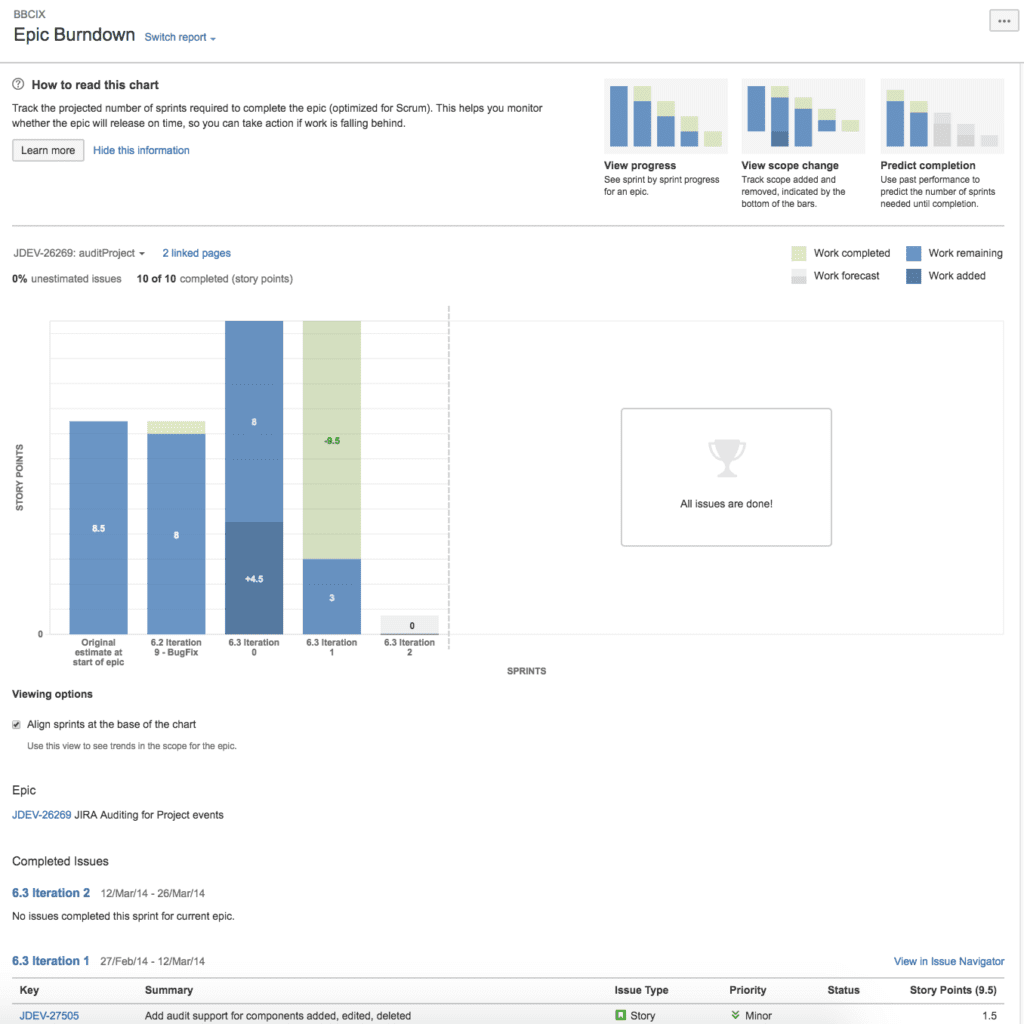
Epic burndown has 4 major points to understand which the following are:
- Epic menu
Choose any type of epic view to show your data. This epic view consists of data blocks called “Stories”
- Work added
The dark blue epic segment shows the total amount of work added to measure work performance.
- Work remaining
As the light blue part shows the remaining work.
- Work completed
The green part of the stories shows the completed work.
- Project completion
Especially, it helps to identify how many sprints it will use to complete an epic, according to the team performance velocity.